


Abstract
Background. Severe malarial anemia (SMA) remains a major cause of pediatric illness and mortality in Sub-Saharan Africa. Here we test the hypothesis that prenatal exposures, reflected by soluble inflammatory mediators in cord blood, can condition an individual's susceptibility to SMA.
Methods. In a Tanzanian birth cohort (n = 743), we measured cord blood concentrations of tumor necrosis factor (TNF), TNF receptors I and II (TNF-RI and TNF-RII), interleukin (IL)-1β, IL-4, IL-5, IL-6, IL-10, and interferon gamma (IFN-γ). After adjusting for conventional covariates, we calculated the hazard ratios (HR) for time to first SMA event with log(e) cytokine concentrations dichotomized at the median, by quartile, and per standard deviation (SD) increase.
Results. Low levels of TNF, TNF-RI, IL-1β, and IL-5 and high levels of TNF-RII were associated statistically significantly and respectively with approximately 3-fold, 2-fold, 8-fold, 4-fold, and 3-fold increased risks of SMA (Hb < 50 g/L). TNF, TNF-RI, and IL-1β concentrations were inversely and log-linearly associated with SMA risk; the HR (95% confidence interval [CI]) per 1-SD increase were respectively 0.81 (.65, 1.02), 0.76 (.62, .92), and 0.50 (.40, .62).
Conclusions. These data suggest that proinflammatory cytokine levels at birth are inversely associated with SMA risk and support the hypothesis that pediatric malarial disease has fetal origins.
Infections by Plasmodium falciparum cause the deaths of an estimated half-million African infants and children every year [1]. Variations in ecology, diversity of host and parasitic factors, and disparities in treatment contribute to the significant heterogeneity in the incidence, severity, and manifestations of malarial disease. In regions of holoendemic transmission, severe malarial anemia (SMA) is the dominant malarial syndrome and predominantly occurs in children <2 years of age [2]. Overall, the burden of SMA in Sub-Saharan Africa is substantial: data from a multicenter study suggest that severe anemia affects approximately one-fifth of pediatric P. falciparum hospitalizations and is associated with a case fatality risk of 8.4% [3].
The pathophysiological process of SMA is complex. During an acute malaria episode, hemolysis and splenic retention of both parasitized and healthy erythrocytes, along with acute iron sequestration and dyserythropoietic changes, directly drive reductions in the host's hemoglobin (Hb) concentrations [4–6]. Moreover, perturbations in the timing and magnitude of the host's innate immune response can influence the efficacy of a host's erythropoietic response [7]. Immunological observations from humans and animal malaria models have begun to elucidate the complex and exquisitely sensitive pathways mediated by cytokines, growth factors, and effector molecules that contribute to the etiology of SMA [7–14]. Perkins et al [15] and others have proposed that the distinctly dysregulated inflammatory profile of SMA is caused by the interaction between parasitic products, including P. falciparum-derived hemozoin, DNA, glycosylphosphotidylinositols, and antigens, and specific characteristics of the host's innate immune system.
Nevertheless, the host characteristics that predispose certain individuals to SMA remain uncertain. Comorbid infections and chronic hematinic deficiencies can contribute to bone marrow suppression and a blunted erythropoietic response in malarial anemia. Furthermore, genetic investigations have identified moderate relations between numerous cytokine promoter polymorphisms and haplotypes and susceptibility to SMA (eg, Kempaiah et al [16], Okeyo et al [12]) in addition to the well-characterized effects of hemoglobinopathies (reviewed in Taylor et al [17]). There is also growing evidence that prenatal exposures and the intrauterine environment may modulate cytokine production and influence malaria risk [18–20]. Transplacental exposure to P. falciparum antigens can sensitize and, in some cases, tolerize the child's Toll-like receptor-mediated and acquired immune responses to parasitic products with implications for malaria and anemia risk later in life [21–24]. In addition, initial investigations in the study population for this report have found inverse associations between levels of interleukin 1β (IL-1β) and tumor necrosis factor (TNF) at birth and risk of all-cause severe malaria during infancy [25].
In this prospective cohort study of infants born in a region of perennial malaria transmission in the United Republic of Tanzania, we test the hypothesis that prenatal exposures or intrinsic predispositions, reflected by soluble inflammatory mediators in cord blood, can condition an individual's susceptibility to SMA. Specifically, we investigate the strength, biological gradient, and specificity of the association with SMA in the first 4 years of life. The cytokines, receptors, and ratios investigated here were selected because of their known associations with acute SMA episodes, eythropoietic suppression, and erythroid precursor maturation.
METHODS
Study Population
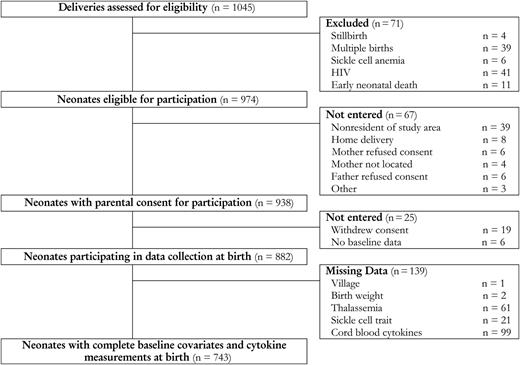
Selection of study population. Abbreviation: HIV, human immunodeficiency virus.
Trained project nurses and assistant medical officers administered questionnaires and collected clinical information using standardized forms. All children were monitored for incident SMA by clinicians during routine visits on a biweekly basis during the first 12 months of life and a monthly basis for any follow-up beyond the first year (median (interquartile range [IQR]) for total duration of follow-up in weeks: 104 (56, 152)). Prompt care was provided to sick children in accordance with Tanzanian Ministry of Health protocols. The primary outcome of this analysis was time in days to first SMA event. SMA cases have been defined as a positive blood smear for P. falciparum in the presence of Hb <50 g/L to meet World Health Organization (WHO) criteria and <60 g/L for the standard definition used in earlier publications on the pathogenesis of SMA [8, 9, 12, 14, 16]. The US National Institutes of Health (NIH) International Clinical Studies Review Committee of the Division of Microbiology and Infectious Diseases approved the study procedures, and the Institutional Review Boards of the Seattle Biomedical Research Institute and the National Institute for Medical Research in Tanzania provided ethical clearance.
Laboratory Measurements
Cord blood samples were collected immediately following parturition using routine procedures for cord clamping and cannulating umbilical blood vessels. Blood samples were treated with EDTA for anticoagulation and fractionated by centrifugation at 3000 g for 3 minutes. Cord blood plasma samples were frozen at −70°C until the immunoassays were performed. Technicians blinded to participants' disease status used commercially available multiplex, bead-based platforms and custom-made assay kits, as previously described, to measure cytokines [25]. The detection limits in the measurement of the cytokines were: TNF, 0.10 pg/mL; TNF-RI, 1.58 pg/mL; TNF-RII, 0.21 pg/mL; IL-1β, 0.01 pg/mL; IL-4, 0.3 pg/mL; IL-5, 0.02 pg/mL; IL-6, 1.45 pg/mL; IL-10, 0.02 pg/mL; and interferon γ (IFN-γ), 0.04 pg/mL. Sickle cell trait was determined by electrophoresis. Parasitemia was determined by Giemsa-stained thick blood smears of samples collected by heel and finger prick during child visits. Hemograms were measured using an impedance-based analyzer.
Statistical Analysis
All statistical analyses were performed using Stata - version 12 (StataCorp LP). P values are for 2-sided tests, and the level of statistical significance has been set at P ≤ .05. Cytokine measurements of zero were replaced by the lowest detectable limit in ratio calculations and log transformations. The correlations between cytokine levels were investigated using Spearman rank correlations. After adjusting for sex, delivery transmission season, thalassemia, sickle cell trait, birth weight, maternal gravidity, and placental malaria at delivery, we calculated the hazard ratios (HR) for time to first SMA event with log(e) cytokine concentrations dichotomized at the median, by quartile, and per standard deviation (SD) increase. Clustering at the village level was accounted for using shared frailties [26]. For IL-4 and IFN-γ, the hazard ratio for incident SMA was compared between individuals with and without detectable cytokine levels. Floating absolute risks were used to assess the shapes of associations across quartiles [27]. Inflammatory mediators with statistically significant log-linear associations with SMA ( <60 g/L) were further analyzed by subgroup.
RESULTS
Participant Characteristics at Delivery by SMA Status (Hb < 60 g/L)
| Characteristic | N | SMA Cases | Noncases | P Valuea | |
|---|---|---|---|---|---|
| N (%) or Median (IQR) | N (%) or Median (IQR) | ||||
| Questionnaire data | Sex | 882 | .958 | ||
| Male | 37 (52.1%) | 420 (51.8%) | |||
| Female | 34 (47.9%) | 391 (48.2%) | |||
| Transmission season | 882 | .517 | |||
| Low | 39 (54.9%) | 413 (50.9%) | |||
| High | 32 (45.1%) | 398 (49.1%) | |||
| Household ITN use | 882 | .033 | |||
| No | 43 (60.6%) | 384 (47.3%) | |||
| Yes | 28 (39.4%) | 427 (52.7%) | |||
| Biological measurements | Thalassemia | 821 | .141 | ||
| α2/ α2 | 40 (58.8%) | 350 (46.5%) | |||
| α2/ α3.7 | 21 (30.8%) | 314 (41.7%) | |||
| α3.7/ α3.7 | 7 (10.3%) | 89 (11.8%) | |||
| Sickle cell trait | 861 | .116 | |||
| AA | 64 (90.1%) | 655 (82.9%) | |||
| AS | 7 (9.9%) | 135 (17.1%) | |||
| Birth weight (kilograms) | 880 | 3.2 (2.8–3.5) | 3.2 (2.9–3.5) | .607 | |
| Maternal characteristics | Maternal gravidity | 882 | .267 | ||
| Primigravid | 15 (21.1%) | 239 (29.5%) | |||
| Secundigravid | 20 (28.1%) | 181 (22.3%) | |||
| Multigravid | 36 (50.7%) | 391 (48.2%) | |||
| Maternal age (years) | 882 | 24 (21–30) | 25 (20–30) | .988 | |
| Any IPTp use | 820 | .883 | |||
| No | 57 (86.4%) | 656 (87.0%) | |||
| Yes | 9 (13.6%) | 98 (13.0%) | |||
| Placental malaria | 882 | .081 | |||
| No | 57 (80.3%) | 710 (87.5%) | |||
| Yes | 14 (19.7%) | 101 (12.5%) | |||
| Placental parasite density (% of infected red blood cells) | 115 | 1.4 (0.9, 2.0) | 1.2 (0.6, 4.6) | .9831 | |
| Biomarker values | TNF (pg/mL) | 783 | 97.7 (43.4–150.5) | 122.7 (72.5–183.8) | .0042 |
| TNF-RI (pg/mL) | 783 | 1472.0 (1138.8–2588.3) | 2182.8 (1572.1–2896.8) | .0005 | |
| TNF-RII (pg/mL) | 783 | 528.8 (332.8–1192.4) | 469.6 (322.8–669.1) | .0358 | |
| IL-1β (pg/mL) | 783 | 3.0 (0.8–5.9) | 6.4 (3.2–12.1) | .0001 | |
| IL-4 (pg/mL) | 783 | 0 (0–0) | 0 (0–0) | .1528 | |
| IL-5 (pg/mL) | 783 | 1.7 (0.4–3.4) | 2.8 (1.0–5.4) | .0024 | |
| IL-6 (pg/mL) | 783 | 6.2 (2.1–16.1) | 7.0 (2.3–18.7) | .561 | |
| IL-10 (pg/mL) | 783 | 3.7 (1.7–6.1) | 3.5 (1.5–6.0) | .6317 | |
| IFN-γ (pg/mL) | 783 | 0 (0–0) | 0 (0–0) | .4891 |
Abbreviations: IFN-γ, interferonγ; IL, interleukin; IQR, interquartile range; ITN, insecticide-treated net; SMA, severe malarial anemia; TNF, tumor necrosis factor.
P values are from Kruskal–Wallis and χ2 tests as appropriate.
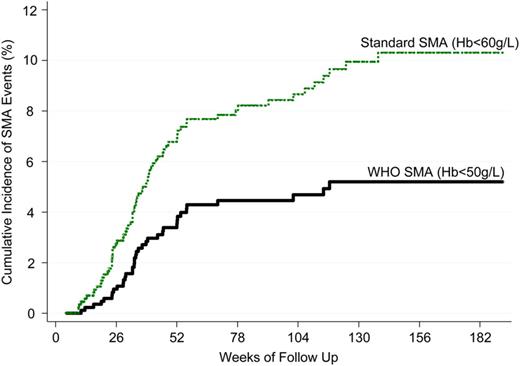
Cumulative SMA incidence by case definition (N = 882 at baseline). Abbreviations: SMA, severe malarial anemia; WHO, World Health Organization.
Cord blood cytokines and receptors were measured in 783 children. The number of measurements at levels detectable by the immunoassays were low for IL-4 (10.9%, n = 85) and IFN-γ (20.6%, n = 161). Measured biomarker values were generally positively correlated, with the highest correlation between TNF and IL-1β (Spearman correlation coefficient: 0.65) (Supplementary Data). TNF, TNF-RI, IL-1β, and IL-5 levels were statistically significantly lower and TNF-RII levels were statistically significantly higher in children who developed SMA (Table1).
Risk of SMA for High vs Low Concentrations of Log(e) Biomarker Value (N = 743)
| Biomarker | WHO SMA (Hb < 50 g/L) | Standard SMA (Hb < 60 g/L) | ||
|---|---|---|---|---|
| HR (95% CI)a,b | P Valuec | HR (95% CI)a,b | P Valuec | |
| TNF | 0.35 (.17, .76) | .008 | 0.64 (.39, 1.05) | .079 |
| TNF-RI | 0.44 (.21, .91) | .026 | 0.55 (.33, .92) | .023 |
| TNF-RII | 2.97 (1.39, 6.36) | .005 | 1.45 (.89, 2.38) | .138 |
| IL-1β | 0.13 (.05, .38) | <.001 | 0.33 (.19, .59) | <.001 |
| IL-5 | 0.25 (.11, .58) | .001 | 0.53 (.32, .90) | .018 |
| IL-6 | 0.98 (.51, 1.89) | .948 | 0.89 (.55, 1.45) | .640 |
| IL-10 | 1.26 (.65, 2.47) | .494 | 1.24 (.75, 2.02) | .400 |
| TNF/IL-10 | 0.38 (.18, .79) | .010 | 0.54 (.32, .90) | .018 |
Abbreviations: CI, confidence interval; HR, hazard ratio; IL, interleukin; SMA,severe malarial anemia; TNF, tumor necrosis factor; WHO, World Health Organization.
Biomarker dichotomized at the median.
Adjusted for village, sex, delivery transmission season, thalassemia, sickle cell trait, birth weight, maternal gravidity, and placental malaria status.
P values are from Wald tests.
Risk of SMA Per 1-SD Increase in Log(e) Biomarker Value (N = 743)
| Biomarker | SD | WHO SMA (Hb < 50 g/L) | Standard SMA (Hb < 60 g/L) | ||
|---|---|---|---|---|---|
| HR (95% CI)a | P Valueb | HR (95% CI)a | P Valueb | ||
| TNF | 1.12 | 0.81 (.65, 1.02) | .070 | 0.83 (.70, .98) | .031 |
| TNF-RI | 0.64 | 0.76 (.62, .92) | .006 | 0.74 (.63, .87) | <.001 |
| TNF-RII | 1.75 | 2.33 (1.08, 5.03) | .030 | 1.26 (.88, 1.80) | .201 |
| IL-1β | 1.80 | 0.50 (.40, .62) | <.001 | 0.58 (.49, .69) | <.001 |
| IL-5 | 1.97 | 0.66 (.50, .88) | .004 | 0.81 (.65, 1.01) | .061 |
| IL-6 | 1.71 | 0.76 (.53, 1.10) | .148 | 0.93 (.73, 1.18) | .543 |
| IL-10 | 1.84 | 1.11 (.79, 1.58) | .548 | 1.08 (.84, 1.39) | .561 |
| TNF/IL-10 | 1.91 | 0.75 (.53, 1.05) | .089 | 0.78 (.61, 1.00) | .053 |
Abbreviations: CI, confidence interval; HR, hazard ratio; IL, interleukin; SD, standard deviation; SMA,severe malarial anemia; TNF, tumor necrosis factor; WHO, World Health Organization.
Adjusted for village, sex, delivery transmission season, thalassemia, sickle cell trait, birth weight, maternal gravidity, and placental malaria status.
P values are from Wald tests.
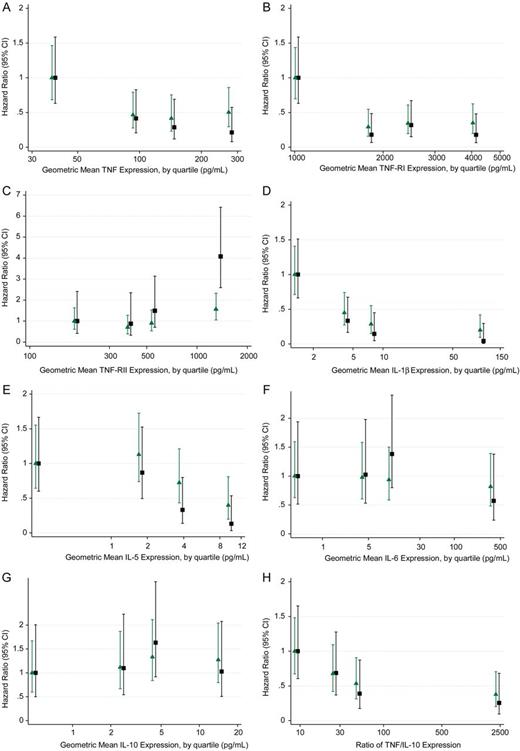
Risk of SMA by quartile of log(e) biomarker value after adjustment for village, sex, delivery transmission season, thalassemia, sickle cell trait, birth weight, maternal gravidity, and placental malaria status. (N = 743) Black squares and green triangles represent HR for WHO (Hb < 50 g/L) and standard (Hb <60 g/L) definitions respectively. The P values for heterogeneity are: (A) TNF (WHO: P = .0054; Standard: P = .0239), (B) TNF-RI (WHO: P = .0004; Standard: P = .0002), (C) TNF-RII (WHO: P = .0022; Standard: P = .1192), (D) IL-1β (WHO: P = .0001; Standard: P < .0001) (E) IL-5 (WHO: P = .0145; Standard: 0.0739), (F) IL-6 (WHO: P = .4209; Standard: P = .9491), (G) IL-10 (WHO: .6585; Standard: .8485), and (H) TNF/ IL-10 (WHO: P = .0487; Standard: P = .0490). Abbreviations: CI, confidence interval; HR, hazard ratio; IL, interleukin; SMA, severe malarial anemia; TNF, tumor necrosis factor; WHO, World Health Organization.
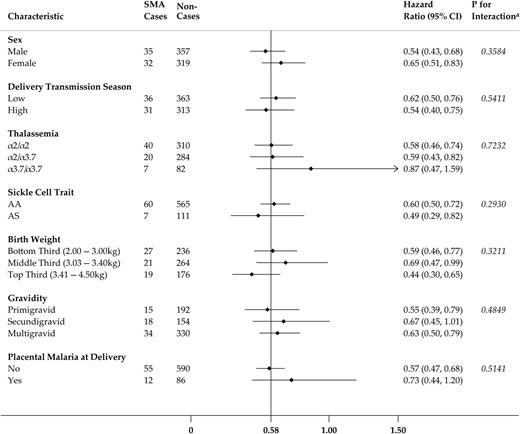
Risk of standard SMA (Hb < 60 g/L) per 1-SD increase in log(e) IL-1β concentration by several participant level characteristics (N = 743). HR is adjusted for the following excluding the stratified covariate: village, sex, delivery transmission season, thalassemia, sickle cell trait, birth weight, maternal gravidity, and placental malaria status. *P values are from likelihood ratio tests. Abbreviations: CI, confidence interval; HR, hazard ratio; IL, interleukin; SD, standard deviation; SMA, severe malarial anemia.
DISCUSSION
The findings of the current analysis support the hypothesis that the prenatal experience can contribute to pediatric susceptibility to SMA. Although previous reports on markers of inflammation in children with SMA have been restricted to analyses of genetic variants and the cross-sectional examination of cytokine levels in acute episodes, the present study provides evidence that innate inflammatory mediator concentrations at birth are associated with a child's subsequent risk of SMA. We found that cord blood cytokine levels were generally positively correlated with the highest correlation between proinflammatory cytokines. We also demonstrated that there are inverse associations between concentrations of proinflammatory cytokines at birth and risk of SMA. TNF, TNF-RI, and IL-1β conferred approximately log-linear protective effects that were robust to stratification by established risk factors. These results are consistent with earlier findings that showed high cord blood levels of TNF and IL-1β are protective against generalized severe malaria [25]. In sum, these findings provide evidence that pediatric malarial disease has fetal origins.
We hypothesize that suboptimal conditions, resulting from maternal stress, infection, or dietary restriction, during critical periods of fetal development could lead to stable alterations in gene expression associated with homeostatic changes to circulating cytokine levels and inflammatory response to parasitic products and, thereby, heighten an individual's susceptibility to SMA. Epidemiological and experimental animal model studies have consistently demonstrated that fetal malnutrition and overexposure to glucocorticoids can developmentally program adult diseases, such as diabetes, hypertension, and anxiety, and are linked to a range of physiological adaptations including modulation of the production and regulation of cytokines [18]. In a rat model of maternal stress, offspring exposed to higher in utero concentrations of glucocorticoids had increased plasma levels of proinflammatory cytokines TNF and IL-1β at 6 months [19]. Similarly, rats that were prenatally exposed to bacterial lipopolysaccharide mount an exaggerated IL-1β response from CD11b+-enriched macrophages and microglia to later stimulation in adulthood [20]. Additionally, rats that were fed protein-restricted diets during pregnancy gave birth to offspring with epigenetic modifications, altered hypothalamic-pituitary-adrenal (HPA) axis sensitivity, and modified proinflammatory cytokine regulation via glucocorticoid resistance [28]. Although the generalizability of these experimental studies of noncommunicable diseases is limited, it is biologically plausible that analogous adaptations could developmentally prime malaria susceptibility.
The results of the current study support a malarial model of fetal programming by demonstrating a strong, dose-response effect, which is robust to stratification by known risk factors, and specific to cytokines that are well-established mediators of analogous neuroendocrinological homeostatic processes. Although the current findings do not causally implicate specific intrauterine exposures in the etiology, these results highlight the potential value of further investigation into the relation of SMA with maternal stressors, epigenetic modifications, and steroid hormone exposures. Broadly, these findings align with the mounting research that children exposed to malaria infections in utero have altered cytokine responses to later exposure to malarial antigens. Additional research is needed to distinguish whether developmental programming effects of maternal infection could be operating in parallel or synergistically with the prenatal sensitization and tolerization to blood-stage antigens that has been observed in other endemic regions [21–24]. Further work is also needed to discern if high maternally derived glucocorticoids immunosuppress fetal production of proinflammatory cytokines and, thus, whether low cord blood levels of TNF or IL-1β could serve as early markers for poor regulatory control of the inflammatory response to parasitic products. Notably, the results, which show lower ratios of TNF/IL-10 at birth are associated with SMA in early life, directly contrast with the previous findings that TNF/IL-10 ratios are higher during acute SMA events and underscore the importance of understanding the balance of the inflammatory milieu over the early life course [10, 11, 13].
The findings of this study also reinforce interest in the complex relationship between high proinflammatory cytokine levels and SMA. Previously, Kabyemela et al [25] found that cord blood levels of TNF and IL-1β levels positively correlate with levels during the first year and that high cord blood IL-1β levels are associated with lower average parasite densities in infancy. Elevated proinflammatory cytokines may play a vital role in controlling parasitemia in the early response to malaria infection, clearing infected erythrocytes, and inducing cell-mediated immunity. However, if, in acute episodes, the host response to these endogenous pyrogens is inadequately abrogated by the HPA axis and antiinflammatory mediators, they may trigger pathological rather than protective outcomes.
While prenatal exposures may influence SMA susceptibility, the current findings do not preclude the importance of host genetics. However, the generally positive correlations between all cytokine levels suggest systemic differences, rather than cytokine-specific promoter mutations, are influencing cord blood expression. Moreover, existing investigations have found only limited evidence for genetic conditioning of SMA through promoters of the cytokines relevant to this analysis. TNF−238A has been correlated with TNF/IL-10 >1, which has been thought to mediate SMA and SMA risk [11, 29]. In addition, the IL-1β promoter haplotype−31C/−511A is associated with statistically significantly decreased circulating IL-1β and increased risk of SMA (OR (95% CI), 1.98 (1.55, 2.29)) [14]. Future research should continue to prioritize the study of specific genetic markers for polymorphisms in cytokine production in large-scale genetic studies, such as those undertaken by the MalariaGEN (http://www.malariagen.net/), although elucidating these relationships could be challenging due to the potentially pleiotropic nature of cytokine promoters.
The strengths and limitations of the current study warrant consideration. This prospective cohort study had both a high response and retention rate and provides the first prospective investigation of cord blood cytokines and risk of SMA. Cases of SMA were robustly ascertained during clinical visits with blood smears and Hb measurements. Assay methods were similar to those used in previous studies on cytokines and SMA. Although the study size is relatively large among malarial anemia studies, the number of cases of SMA that fit the criteria of the more stringent WHO case definition (Hb < 50 g/L) was small (n = 37). For stratification purposes, the broader standard definition (Hb < 60 g/L) of SMA was used despite the potential for decreasing the specificity of the examined relationships. Although the associations between cytokines and SMA are generally consistent across the definitions, the statistically significant protective effect of IL-5 and pathogenic effect of TNF-RII were only discernible when the definition was limited to the WHO-defined cases. Conversely, the risk of SMA per 1-SD increase in TNF and TNF/IL-10 lost statistical significance using the stricter definition. To address this issue, future studies should aim to accrue larger sample sizes, which would also allow for comparative analyses with other severe malaria syndromes, such as cerebral malaria, that are uncommon in this population, and to allow a longer duration of follow-up, which would provide greater time to observe SMA events in individuals who are included in the study but for whom SMA events are not yet observed by the conclusion of the study. There is also a risk that residual confounding, such as pregnancy malaria episodes that were resolved by the time of parturition, could lead to conservative effect estimates. Although published findings have been conflicting to date (reviewed in [30, 31]), another unmeasured variable worth consideration is comorbid parasitic infection (eg, an intestinal helminth infection) at the time of the SMA episode that could alter a child's susceptibility to malaria infection and contribute to the etiology of anemia. Furthermore, it would be valuable to investigate any contribution by nonmalarial parasitic infections in the pregnant mother on the child's cord blood cytokine expression. The study design inherently introduces a risk of selection bias because only 50.2% of Tanzanian deliveries occur in health facilities, and women who use health facilities are more likely to be younger, wealthier, better educated, and urban dwellers [32]. Finally, although the majority of SMA cases occur in regions of persistent malaria transmission, it is unknown whether the current findings will be generalizable across regions with seasonally varying entomological inoculation rates.
Identifying characteristics that contribute to pathological or protective outcomes following malaria infection can help to elucidate etiological pathways and has the potential to inform the rational design of vaccines and therapeutic measures. This study demonstrates that there is an inverse and approximately log-linear association between proinflammatory cytokine levels in cord blood and SMA risk over the first 4 years of life. These findings highlight an interventional window of opportunity that precedes the dysregulation in inflammatory mediators that develops acutely during an infection. In addition, this study lends support to the hypothesis that there may be fetal origins of malarial disease. Further study is needed to identify biological mechanisms that determine fetal cytokine profiles and to understand the regulation of cytokine concentrations over time.
Notes
Acknowledgments. The authors thank the families who have participated in this study.
Financial support. This work was supported by the Division of Intramural Research, National Institute of Allergy and Infectious Diseases of the National Institutes of Health, the Bill & Melinda Gates Foundation [grant number 29202], the Foundation for the NIH through the Grand Challenges in Global Health Initiative [grant 1364], the National Institutes of Health Fogarty International Center [grant D43 TW005509], and the National Institutes of Health [grant R01 AI52059], all grants to P. E. D.
Potential conflicts of interest. All authors: No reported conflicts.
All authors have submitted the ICMJE Form for Disclosure of Potential Conflicts of Interest. Conflicts that the editors consider relevant to the content of the manuscript have been disclosed.
References
Author notes
Scientific Meetings: This work has been presented as Abstract 190 at the American Society of Tropical Medicine and Hygiene Annual Meeting held 13–17 November 2013 in Washington, D.C., and at the Keystone Symposium on Epigenetic Programming and Inheritance held 6–10 April 2014 in Boston, Massachusetts.

