


Abstract
Background. Because pneumococcal pneumonia was prevalent during previous influenza pandemics, we evaluated invasive pneumococcal pneumonia (IPP) rates during the 2009 influenza A(H1N1) pandemic.
Methods. We identified laboratory-confirmed, influenza-associated hospitalizations and IPP cases (pneumococcus isolated from normally sterile sites with discharge diagnoses of pneumonia) using active, population-based surveillance in the United States. We compared IPP rates during peak pandemic months (April 2009–March 2010) to mean IPP rates in nonpandemic years (April 2004–March 2009) and, using Poisson models, to 2006–2008 influenza seasons.
Results. Higher IPP rates occurred during the peak pandemic month compared to nonpandemic periods in 5–24 (IPP rate per 10 million: 48 vs 9 (95% confidence interval [CI], 5–13), 25–49 (74 vs 53 [CI, 41–65]), 50–64 (188 vs 114 [CI, 85–143]), and ≥65-year-olds (229 vs 187 [CI, 159–216]). In the models with seasonal influenza rates included, observed IPP rates during the pandemic peak were within the predicted 95% CIs, suggesting this increase was not greater than observed with seasonal influenza.
Conclusions. The recent influenza pandemic likely resulted in an out-of-season IPP peak among persons ≥5 years. The IPP peak's magnitude was similar to that seen during seasonal influenza epidemics.
Streptococcus pneumoniae, or pneumococcus, is the most common vaccine-preventable bacterial cause of death in the United States [1], causing approximately 22 000 deaths and 4 million illnesses, including otitis media, pneumonia, and meningitis, annually [2]. Influenza infection can facilitate pneumococcal adherence and invasion, and influenza and pneumococcus may act synergistically to cause more severe disease than with either pathogen alone [3, 4]. Animal models and epidemiologic data indicate that influenza is associated with pneumococcal pneumonia but have not confirmed an association with other pneumococcal syndromes [3–7].
Pneumococcal pneumonia has been associated with excess morbidity and mortality during past influenza pandemics, especially in 1918–1919 [8–10]. Early reports during the 2009 influenza A(H1N1) pandemic identified pneumococcal coinfections among severe and fatal cases of pandemic influenza A(H1N1)pdm09 (pH1N1) infection [11–13]. An increase in empyema hospitalizations, including pneumococcal empyema, was seen among children in Utah during the spring and summer of 2009 [14]. Additionally, discharge diagnosis data from the United States showed an increase in pneumococcal pneumonia hospitalizations among people 5–64 years old during the fall of 2009, the time of highest pH1N1 activity [15]. During October 2009, active, population-based surveillance in Colorado detected a 3-fold increase above previous Octobers in invasive pneumococcal disease coincident with the pH1N1 activity peak [16]. The October increase in invasive pneumococcal disease in Colorado was unusual as the seasonality and winter peak of invasive pneumococcal disease is known to be very consistent, peaking typically in late December into early January [7]. Because of the reports from Utah and Colorado, we sought to determine if similar increases in invasive pneumococcal disease, particularly pneumonia, were occurring in other areas of the United States; if individual pneumococcal risk factors or particular pneumococcal serotypes could be playing a role; and if the impact of pH1N1 infection on pneumococcal pneumonia was greater than that of previous influenza seasons.
Our objectives were 3-fold. Using surveillance data from Active Bacterial Core surveillance (ABCs) and FluSurv-Net, we first determined whether pH1N1 infection caused an out-of-season increase in invasive pneumococcal pneumonia (IPP) and examined characteristics, including risk factors, associated with IPP during the 2009 pandemic. Second, we examined whether any increase in IPP was associated with one or more pneumococcal serotypes. Finally, we determined whether pH1N1 infection caused excess IPP as compared with previous influenza seasons.
METHODS
Surveillance for IPP and Influenza-associated Hospitalizations
We performed an ecological analysis using IPP and influenza-associated hospitalization rates calculated from active, population-based surveillance data from ABCs [17, 18] and FluSurv-NET [19]. ABCs is a geographically diverse surveillance network for invasive bacterial infections. FluSurv-NET is a surveillance network for laboratory-confirmed, influenza-associated hospitalizations. Both networks are part of the Emerging Infections Program, and surveillance is conducted in all or part of 10 states: California, Colorado, Connecticut, Georgia, Maryland, Minnesota, New Mexico, New York, Oregon, and Tennessee [20]. We restricted this analysis to the 57 counties included in both ABCs and FluSurv-NET, excluding the 5-county surveillance area in Colorado, as excess pandemic-associated invasive pneumococcal disease was previously documented there and could potentially drive an association when all sites were analyzed together [16].
We defined invasive pneumococcal disease cases as S. pneumoniae isolated from a normally sterile site in a surveillance-area resident. We defined the subset of cases with a discharge diagnosis of pneumonia as IPP and focused the remainder of our analysis on IPP, as the association between influenza and pneumococcus is particular to pneumonia [3–7]. We included IPP cases that occurred during the baseline period of April 2004–March 2009, following invasive pneumococcal disease rate stabilization after 7-valent pneumococcal conjugate vaccine (PCV7) introduction [21], and during the pandemic period of April 2009–March 2010. Influenza-associated hospitalization cases were identified based on a positive laboratory test for influenza in a surveillance-area resident who was hospitalized during the pandemic period, April 2009–March 2010. Influenza laboratory confirmation was based on a positive result from viral culture, direct or indirect fluorescent antibody staining, rapid antigen test, reverse transcription polymerase chain reaction, or documentation of a positive test result in a patient's medical record [22, 23]. Only cases reported by October 2010 were included in the analysis.
Estimation of Influenza Pandemic Peak and IPP Rates
To determine if pH1N1 infection was associated with an out-of-season IPP increase, we compared IPP incidence during the peak pandemic influenza month with the same month during comparison years. We defined the peak pandemic month in each surveillance site as the month during April 2009–March 2010 with the highest rate of influenza-associated hospitalizations. Given that >99% of circulating influenza virus during the pandemic was pH1N1 [24], we assumed that influenza-associated hospitalizations from April 2009–March 2010 were caused by pH1N1 rather than seasonal influenza viruses.
To examine IPP rates during the peak pandemic month by age group, we calculated IPP rates for the peak pandemic month across all sites using US Census annual population estimates for each site and age group [25]. We used the following age groups: <5, 5–24, 25–49, 50–64, and ≥65 years. We summed IPP cases during the peak pandemic month within age categories and across all sites. For example, the peak pandemic month in California was October, and in Connecticut it was November. Therefore, we added IPP cases among children <5 years old from California in October to IPP cases in Connecticut in November. We also added the site-specific population denominators for each age group during each site's peak pandemic month. We calculated the peak pandemic month, age-specific IPP rate by dividing the total IPP case number within each age group across all sites by the population in each age group across all sites during the peak pandemic month.
To determine whether the observed IPP rates during the peak pandemic month exceeded rates during the comparison month, we estimated rates during the comparison months. We defined the comparison month in each site as the same month during each year of the baseline period as the peak pandemic month in 2009. For example, in California, the comparison month cases consisted of IPP cases in California in Octobers of 2004, 2005, 2006, 2007, and 2008. We summed IPP cases within each age group for each site's comparison month and then divided by the population in each age-group for each site's comparison month to produce a rate for the comparison month in each year of the baseline period. We estimated the mean age-group specific, baseline IPP rate, weighted by annual population denominators, for the comparison month with 95% confidence intervals (CI). We defined excess IPP as an age-specific IPP rate during the peak pandemic month that exceeded the 95% CI above the baseline age-specific IPP mean rate for the comparison month. We did not calculate age-specific rates by site due to the small number of cases at each site in each age group.
Using the same approach, we calculated IPP rates for the peak pandemic month and the comparison month by site with all age groups combined. Although Colorado was excluded from the overall analysis, we calculated the IPP rate for the peak pandemic month and comparison month for the 5-county Colorado surveillance area for ABCs and FluSurv-NET for all age groups. This subanalysis allowed validation of our analytic methods against published data and comparison among all sites. For both age- and site-specific rates, we calculated rate ratios with 95% CIs, calculated from the 95% CIs of the mean IPP rate during the comparison months.
Comparison of IPP Cases During Pandemic and Nonpandemic Periods
To determine whether IPP cases during the pandemic differed epidemiologically from IPP cases during a non-pandemic period, we characterized cases by age, sex, hospitalization status, outcome, and pneumococcal risk factors. We defined pneumococcal risk factors as medical conditions that are indications for use of 23-valent pneumococcal polysaccharide vaccine at age <65 years or 13-valent pneumococcal conjugate vaccine (PCV13) up to age 72 months [26, 27]. We further divided pneumococcal risk factors into immunocompromising conditions (other than asplenia), asplenia (functional or physical), and immunocompetent chronic illnesses [26, 27]. We calculated χ2 test statistics to determine if case characteristics differed between the peak pandemic month and the comparison month. As we made multiple comparisons, we used a Bonferroni correction and considered P < .006 as significant for case characteristics [28]. Using logistic regression, we assessed for interaction and calculated odds ratios by age group and pneumococcal risk factors for having IPP during the peak pandemic month compared with the comparison month, using those ≥65 years with pneumococcal risk factors as the referent group. We calculated intramodel contrasts using explicit estimation of the interaction terms.
Serotype Analysis
To determine whether any particular serotype was driving an increase in IPP, we compared IPP case serotypes during the peak pandemic month with the comparison month. Serotypes were divided into those included in PCV7 (4, 6B, 9V, 14, 18C, 19F, and 23F) plus 6A as the vaccine provides cross-protection against 6A [29]; serotypes 3, 7F, 19A all included in PCV13; and other serotypes. We compared the percent of serotyped cases in each group during the peak pandemic month with the comparison month for each age group using Fisher exact test. For each serotype group, we compared the peak pandemic month with the comparison month among sites using the Cochran-Mantel-Haenszel test.
Comparison of IPP Rates During Pandemic Period to Previous Influenza Seasons
To determine if IPP rates during the peak pandemic month exceeded what would be expected during a similar peak of seasonal influenza, we estimated baseline monthly IPP rates during the 2006–2008 influenza seasons (April 2006–March 2009). We used a baseline period starting in 2006 as influenza-associated hospitalization surveillance in FluSurv-NET was expanded to all age groups in 2006. We used a univariate Poisson model with calendar month as the only predictor for IPP rate. This allowed us to obtain a mean IPP rate, while controlling for overdispersion, a problem often encountered in data sets with large variance relative to cell counts. Next, we built a multivariate Poisson model, which included month and influenza hospitalization rate as predictors. This allowed us to estimate the predicted monthly IPP rate in 2009, assuming the pH1N1 virus had the same effect on IPP as seasonal influenza viruses had on IPP in the previous 3 years. Both models were run by site and by age group (<5 years and ≥5 years). We summed results across sites. Finally, we compared the actual 2009 IPP rates to the baseline mean from the univariate model and to the predicted 2009 IPP rate from the multivariate model.
We used SAS 9.2 (SAS Institute Inc, Cary, North Carolina). Because the data were collected as part of routine public health surveillance, the analysis was considered exempt from human subjects review.
RESULTS
From April 2009–March 2010, active surveillance identified 5721 influenza-associated hospitalizations and 2240 cases of invasive pneumococcal disease, of which 1574 (70.3%) were IPP. The 2009 peak pandemic month was September in 2 sites (Georgia and Tennessee), October in 5 sites (California, Maryland, Minnesota, New Mexico, and Oregon), and November in 2 sites (Connecticut and New York). During the peak pandemic month, 185 IPP cases were identified. The proportion of IPP cases occurring among 5- to 24-year-olds was significantly higher during the peak pandemic month (11.9%) than in the comparison month (3.7%, P < .001; Table 1). Persons with IPP during the peak pandemic month did not differ significantly from those with IPP during the comparison month by sex, hospitalization status, or mortality. However, significantly fewer IPP cases during the peak pandemic month had pneumococcal risk factors (56.2%) compared with the comparison month (75.6%, P ≤ .0001).
Characteristics of Patients With IPP During the Peak Pandemic Month vs the Comparison Month for 9 Surveillance Sites
| Characteristics | Peak Pandemic Month, 2009 185 IPP Cases | Comparison Month in 2004–2008 573 IPP cases | P Valuea |
|---|---|---|---|
| Age group | |||
| <5 y | 10 (5.4) | 37 (6.5) | |
| 5–24 y | 22 (11.9) | 21 (3.7) | |
| 25–49 y | 48 (26.0) | 168 (29.3) | |
| 50–64 y | 60 (32.4) | 173 (30.2) | |
| ≥65 y | 45 (24.3) | 174 (30.4) | .0006a |
| Male sex | 97 (52.4) | 305 (53.2) | .85 |
| Hospitalized | 173 (93.5) | 532 (92.8) | .76 |
| Mortality | 16 (8.7) | 52 (9.1) | .86 |
| Pneumococcal risk factors (total)b | 104 (56.2) | 433 (75.6) | ≤.0001a |
| Immunocompromisingb | 39 (21.1) | 206 (36.0) | ≤.0001a |
| Aspleniab | 2 (1.1) | 8 (1.4) | .74 |
| Immunocompetent with chronic illnessb | 95 (51.3) | 362 (63.2) | .004a |
Data are no. (%) of cases unless otherwise indicated.
Abbreviation: IPP,invasive pneumococcal pneumonia.
aP value < .006 considered significant by Bonferroni correction.
b Advisory Committee on Immunization Practices
We identified significant excess IPP during the peak pandemic month in all age groups except children <5 years, with the most pronounced excess occurring among persons 5–24 years (Table 2). Excess IPP during the peak pandemic month occurred in 4 of 9 sites: Georgia, New Mexico, New York, and Oregon (Table 3). Additionally, Connecticut and Tennessee had peak pandemic month IPP rates just below the upper 95% CI of the comparison month mean IPP rate. Results by site were similar when children <5 years were excluded (data not shown).
Rate of IPP During Peak Pandemic Month vs the Comparison Month by Age Group, for 9 Surveillance Sites
| Age | Peak Pandemic Month, 2009 | Comparison Month in 2004–2008, Mean IPP Rate per 10 million (95% CI) | IPP Rate Ratio of Peak Pandemic to Mean Comparison Month Rate (95% CI) | ||
|---|---|---|---|---|---|
| IPP Case Count | Population | IPP Rate per 10 million | |||
| <5 y | 10 | 1 369 463 | 73 | 56 (22–89) | 1.3 (.8–3.3) |
| 5–24 ya | 22 | 4 598 745 | 48 | 9 (5–13) | 5.3 (3.7–9.6) |
| 25–49 ya | 48 | 6 485 269 | 74 | 53 (41–65) | 1.4 (1.1–1.8) |
| 50–64 ya | 60 | 3 199 263 | 188 | 114 (85–143) | 1.6 (1.3–2.2) |
| ≥65 ya | 45 | 1 965 385 | 229 | 187 (159–216) | 1.2 (1.1–1.4) |
Abbreviations: CI, confidence interval; IPP,invasive pneumococcal pneumonia.
a Excess cases during the peak pandemic month as compared to the comparison month in 2004–2008.
Rate of IPP During Peak Pandemic Month vs the Comparison Month by Site, for All Sites
| Site | Peak pH1N1 Month | Peak Pandemic Month, 2009 | Comparison Month in 2004–2008 | IPP Rate Ratio of Peak Pandemic to Mean Comparison Month (95% CI) | ||
|---|---|---|---|---|---|---|
| IPP Case Count | Population | IPP Rate per 10 million | Mean IPP Rate per 10 million (95% CI) | |||
| California | October | 10 | 989 267 | 101 | 89 (42–136) | 1.1 (.7–2.4) |
| Coloradoa,b | October | 48 | 2 441 846 | 197 | 57 (39–75) | 3.5 (2.6–5.1) |
| Connecticut | November | 17 | 848 006 | 200 | 147 (92–201) | 1.4 (1.0–2.2) |
| Georgiab | September | 24 | 3 893 877 | 62 | 38 (25–52) | 1.6 (1.2–2.5) |
| Maryland | October | 23 | 2 642 928 | 87 | 73 (46–101) | 1.2 (.9–1.9) |
| Minnesota | October | 25 | 2 846 576 | 88 | 65 (32–99) | 1.4 (.9–2.8) |
| New Mexicob | October | 19 | 1 117 047 | 170 | 61 (25–97) | 2.8 (1.8–6.8) |
| New Yorkb | November | 34 | 2 134 689 | 159 | 97 (63–130) | 1.6 (1.2–2.5) |
| Oregonb | October | 24 | 1 650 316 | 145 | 64 (41–87) | 2.3 (1.7–3.5) |
| Tennessee | September | 9 | 1 495 419 | 60 | 34 (7–61) | 1.8 (1.0–8.6) |
Abbreviations: CI, confidence interval; IPP,invasive pneumococcal pneumonia; pH1N1, pandemic influenza A(H1N1).
a Colorado included for comparison purposes only.
b Excess cases during the peak pandemic month as compared to the comparison month in 2004–2008.
In the multivariable logistic regression model, age-group and presence of pneumococcal risk factors had borderline significant interaction, P = .059, and thus we calculated intramodel contrasts using explicit estimation of interaction terms (Table 4). Persons 5–64 without risk factors and those 5–24 with risk factors were both more likely than the usual highest-risk group, persons ≥65 with risk factors, to have acquired IPP during the peak pandemic month, as compared with the comparison month.
Odds Ratios for IPP Occurring During Pandemic vs During Comparison Month by Age and ACIP Indication for Vaccination for 9 Surveillance Sites
| Odds Ratio (95% CI) for IPP During Peak Pandemic Month vs Comparison Month | ||
|---|---|---|
| Age | Absence of a Pneumococcal Risk Factora | Presence of a Pneumococcal Risk Factora |
| <5 y | 1.18 (.54–2.62) | NDb |
| 5–24 y | 4.42 (2.00–9.79) | 4.14 (1.26–13.62) |
| 25–49 y | 3.71 (1.95–7.08) | 0.66 (.36–1.17) |
| 50–64 y | 2.46 (1.25–4.84) | 1.21 (.73–2.00) |
| ≥65 y | 1.43 (.64–3.21) | Referent |
Abbreviations: ACIP, Advisory Committee on Immunization Practices; CI, confidence interval; IPP, invasive pneumococcal pneumonia.
a ACIP indication for 23-valent pneumococcal polysaccharide vaccine at <65 years of age or 13-valent pneumococcal conjugate vaccine up to age 72 months [26, 27].
b ND = not defined due to small cell size.
Overall, PCV7 serotypes were infrequent in all age groups during the peak pandemic and comparison months. Serotype 19A was the most prevalent serotype among children <5 years old, whereas 7F was more common among older age groups. The serotype distributions during the peak pandemic and comparison months were similar within 3 age groups: <5, 5–24, and 50–64 years (Figure 1). However, among 25–49- and ≥65-year-olds, the serotype distribution was different (P < .01 for both), driven primarily by increases in 7F and PCV7 serotype decreases during the peak pandemic month vs the comparison month (Figure 1). In these 2 age groups, serotype 7F caused an increasing proportion and PCV7 serotypes caused a decreasing proportion of IPP cases in each successive year, suggesting that our observations reflected the continuation of a prepandemic trend (data not shown). The distribution of the serotype groups was not significantly different among sites (data not shown).
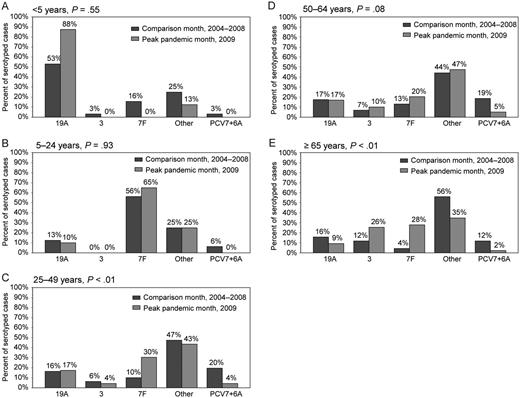
Serotype distributions (19A, 3, 7F, PCV7 + 6A, and other serotypes) by age group: (A) <5 years of age, (B) 5–24 years of age, (C) 25–49 years, (D) 50–64 years, and (E) ≥65 years by peak pandemic month and comparison month.
Finally, to compare IPP rates during the pandemic to previous influenza seasons, we used 2 Poisson models. In the univariate Poisson model, which included calendar month as the only predictor, the actual IPP rate during October 2009 did not exceed the upper limit of the 95% CI of the mean baseline rate for children <5 years old. The multivariate model, which included terms for month and influenza rate, predicted an increase in IPP during October and November of 2009 that did not occur (Figure 2). These models indicate that pH1N1 was not associated with an increase in IPP in children <5 years. Conversely, among persons ≥5 years old, the actual IPP rate exceeded the upper 95% CI of the mean baseline rate in the univariate model during October 2009. This suggests that pH1N1 infection led to an increase in IPP incidence. The observed rate of IPP among persons ≥5 years during October 2009 was within the 95% CI of the predicted IPP rate in the multivariate model, suggesting that the increase in IPP associated with pH1N1 infection was similar to that seen during the 2006–2008 influenza seasons (Figure 3). Finally, among persons ≥5 years, a decrease in IPP occurred during February 2010 that fell below the lower 95% CI of the mean baseline in the univariate model and was not predicted by the multivariate model.
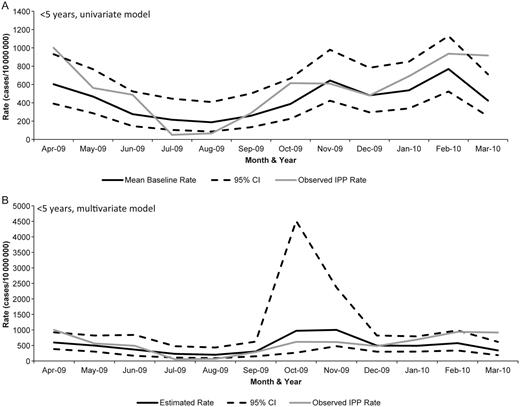
Poisson models for children <5 years of age: (A) univariate model with monthly mean baseline (estimated from 2006–2008) and actual IPP rate (during 2009) and (B) multivariable model with month and rate of laboratory-confirmed influenza hospitalization terms. Of note, the y-axes vary between the graphs.
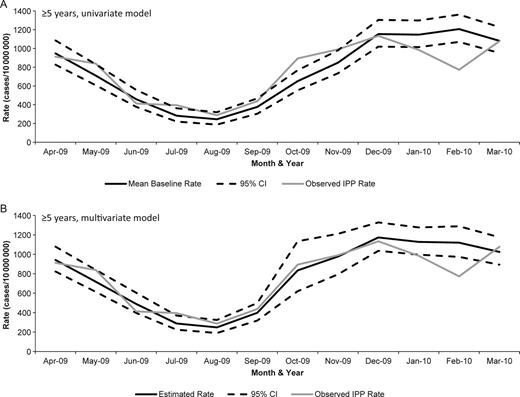
Poisson models for persons ≥5 years of age: (A) univariate model with monthly mean baseline (years 2006–2008) and actual IPP rate (2009) and (B) multivariable model with month and rate of influenza hospitalization terms.
DISCUSSION
Our analysis showed an out-of-season excess of IPP in association with pH1N1. This excess was most pronounced in persons 5–24-years-old and was statistically significant in all age groups except those <5 years. The risk of IPP during the pH1N1 peak appeared to vary by age, with 5- to 24-year-olds having the greatest increase in IPP rate compared with nonpandemic months (rate ratio, 5.3). Furthermore, IPP during the pandemic affected younger individuals without known pneumococcal risk factors, indicating that pH1N1 may have been a risk factor for IPP. Finally, for those >5 years old the impact of pH1N1 on IPP was similar to that of the 2006–2008 influenza seasons.
Our study demonstrated statistically significant increases in IPP during the pandemic among persons >5 years old, which is consistent with other studies. Using 2 complementary analytic methods with active, population-based surveillance data of laboratory-confirmed cases of influenza and IPP, our data support the findings of Weinberger who also observed an increase in pneumococcal pneumonia hospitalizations during fall 2009 [15]. Our findings are also similar to increases noted in pneumococcal empyemas in Utah [14] and in pneumococcal disease in Colorado [16]. However, the increase in IPP was much more evident in Colorado (rate ratio 3.5) than in the other ABCs sites (rate ratios 1.1–2.8). It is unknown whether the increased rate ratio in Colorado is truly a reflection of greater influence of the pandemic compared to other ABCs sites or whether other factors that are not measureable in this study could explain these differences.
Persons with IPP during the pandemic were less likely to have traditional pneumococcal disease risk factors. Extraordinarily high pH1N1 attack rates likely increased the risk of IPP among young healthy people. Due to a high prevalence of cross-reactive immunity to pH1N1 [30], persons over 65 years had relatively low pH1N1 attack rates [31], and influenza-associated increases in IPP were not observed. During the comparison months, 76% of IPP cases had pneumococcal risk factors, whereas during the pH1N1 peak, only 56% had pneumococcal risk factors. Thus, pH1N1 infection may have increased the risk of IPP among young, healthy people, a group that is typically at low risk of IPP. The IPP increase during the pandemic mirrors the epidemiology of pH1N1 infections, suggesting that the association is possibly causal.
The impact of pH1N1 infection on IPP did not appear to be greater than the impact of seasonal influenza viruses during the 2006–2008 influenza seasons. The observed, increased IPP rate among those ≥5 years old during October 2009 was within the 95% CI of that predicted by our multivariate Poisson model, which included influenza-associated hospitalization rates. This estimation demonstrates that the impact of pH1N1 infection on IPP was comparable in magnitude to that of seasonal influenza viruses during the 2006–2008 influenza seasons, which is also consistent with findings among adults from Weinberger [15]. Weinberger also found an increase of pneumococcal pneumonia hospitalizations among 5- to 19-year-olds above what would be expected from previous influenza seasons [15], similar to a study in Nicaragua which found an increase in lower respiratory tract infection among 2- to 14-year-olds [32]. However, we did not have the power to examine the 5–19 age stratum in our model. Nonetheless, the incidence of IPP was not increased during the 2009 pandemic compared with the 2006–2008 influenza seasons.
The 2009 influenza pandemic was not as severe as the 1918–1919 pandemic, in which pneumococcal pneumonia played a role in morbidity and mortality [8–10]. Influenza seasons and pandemics vary in severity, in part because different viruses have different virulence [33–36]. Unlike previous influenza pandemics, PCV7 was in wide use in the United States during the 2009 pandemic, likely affecting the incidence of IPP. PCV7, which was introduced for young children in the United States in 2000, has led to significant decreases in IPP rates in all age groups, with the largest decreases seen in children <5 years old [21]. PCV7 and PCV9 have been shown to reduce influenza-associated pneumonia in young children [6, 37], and one decision-analytic model suggests that PCV7 could prevent deaths due to pneumococcus during a severe influenza pandemic [38]. In our analysis, PCV7 serotypes caused very few cases of IPP during the pandemic.
Our analysis is subject to the following limitations. First, this ecological analysis was unable to distinguish whether excess IPP seen during the pandemic resulted from increased pneumococcal circulation in the setting of influenza or coinfections with pneumococcus and influenza. We were unable to assess the true risk of IPP for persons with pneumococcal risk factors, as we did not have denominators for these groups. In our Poisson models, we were unable to fully predict the IPP decrease during February 2010, as this decrease is likely not entirely attributable to the decrease in pH1N1 during early 2010. One potential reason for this is that our models did not account for the circulation of noninfluenza respiratory viruses that can be associated with pneumococcal pneumonia [4, 6]. However, surveillance data from the United States during January–March 2010 showed that the percent of positive laboratory specimens for respiratory syncytial virus, and parainfluenza viruses did not markedly differ from the same months in 2008 and 2009 (CDC, National Respiratory and Enteric Virus Surveillance System, unpublished data). Finally, we used influenza-associated hospitalization rates from several years in the multivariate Poisson model, and these rates are affected by testing practices for influenza that are known to vary [39]. Testing for influenza was most likely increased during the 2009 pandemic—compared to nonpandemic seasons—due to increased awareness and an increase in resources devoted to influenza monitoring. Thus, the impact of seasonal influenza on IPP is likely underestimated in our multivariate Poisson model.
In conclusion, during the peak of the 2009 pandemic, there was an out-of-season increase in IPP among those age ≥5 years. The epidemiology of the IPP increase mirrored that of pH1N1 virus, suggesting that the 2009 pandemic led to the increased incidence of IPP. This increase in IPP was comparable to that which would be expected during a typical influenza season. The clear association between IPP and influenza during pandemic and nonpandemic periods highlights the importance of pneumococcal prevention practices, especially vaccination, during influenza pandemics and every influenza season.
Notes
Acknowledgments. We gratefully acknowledge the help of the following individuals who contributed greatly to the paper through their work with ABCs and FluSurv-Net at the following sites. Connecticut: Heather Altier and Carmen Marquez; Georgia: Kyle Openo, Olivia Almendares, Wendy Baughman, Stephanie Thomas, and Amy Holst; Maryland: Rosemary Hollick and Terresa Carter; Minnesota: Craig Morin, Dave Boxrud, Billie Juni, Lori Triden, Val Solovjovs, and Richard Danila; New Mexico: Sarah Khanlian, Robert Mansmann, Lisa Butler, Kathy Angeles, Nathan Blacker, and the New Mexico surveillance officers; New York: Nancy Spina, Glenda Smith, Jillian Karr, and Kari Burzlaff; Oregon: Jamie Thompson; Tennessee: Brenda G. Barnes.
Permission for personal communications. Permission for unpublished date from National Respiratory and Enteric Virus Surveillance System obtained from Amber Haynes, epidemiologist with the Division of Viral Diseases, National Center for Immunization and Respiratory Diseases.
Financial support. The Emerging Infections Program (EIP) is a collaboration of state health departments, academic institutions, and local partners and is funded by the Centers for Disease Control and Prevention (CDC). The contents of this publication are solely the responsibility of the authors and do not necessarily represent the official views of the CDC.
Potential conflicts of interest. W. S. is a member of data safety monitoring boards for Merck and Sanofi-Pasteur and occasionally consults for Pfizer, GlasoSmithKline, and Dynavax. L. H. consults for Pfizer and Merck. All other authors: No reported conflicts.
All authors have submitted the ICMJE Form for Disclosure of Potential Conflicts of Interest. Conflicts that the editors consider relevant to the content of the manuscript have been disclosed.
References
Author notes
Meeting presentations: Previously presented as a poster at the 2011 Epidemic Intelligence Service Conference: April 11, 2011; Atlanta, GA.

