


Abstract
Background. Fibrosis progression varies markedly in hepatitis C virus (HCV)–infected individuals. We investigated factors that influence fibrosis progression in chronic HCV infection.
Methods. HCV-infected patients who underwent at least 2 liver biopsies were included in this study. Associations between fibrosis progression and epidemiologic, virologic, and disease-associated factors were analyzed using logistic regression and multistate Markov modeling.
Results. We analyzed 936 biopsy specimens obtained from 378 individuals. Mean age (±SD) at first biopsy was 48.3 ± 9.3 years, 59.3% of patients were male, 59.9% were white, and 86.7% were infected with HCV genotype 1. Fibrosis progression and cirrhosis occurred in 57.4% and 5.8%, respectively. Fibrosis progression between the first and last biopsies was associated with lower fibrosis in the first biopsy specimen (P < .001) and with the occurrence of at least 1 flare in the alanine aminotransferase (ALT) level (>200 U/L; P = .007). We found the highest fibrosis progression rate between stages 0 and 1 and the lowest between stages 2 and 3. Increased necroinflammation and higher ALT level were associated with faster progression. HCV genotype 3–infected patients were more likely to progress to cirrhosis (P < .001).
Conclusions. Fibrosis progression in HCV is not linear but varies according to stage, with the highest progression in patients with the lowest fibrosis severity. Patients who experience flares in the ALT level are also more likely to progress.
Hepatitis C virus (HCV) infection is a leading cause of chronic liver disease globally. If untreated, it can lead to progressive liver fibrosis, cirrhosis, hepatocellular carcinoma, and death [1]. With successful treatment and viral eradication, recent data have demonstrated decreases in all-cause mortality, mortality due to cirrhosis, and a reduction in the incidence of hepatocellular carcinoma [2–4]. Unfortunately, despite recent developments in HCV treatment and the arrival of highly effective and simplified therapeutic regimens [5], many individuals remain unaware of their infection, and various obstacles still limit access to HCV care, leaving many patients untreated.
The rate of histologic progression has been shown to vary considerably between patients with chronic HCV infection: while some rapidly develop cirrhosis and end-stage liver disease, the majority has relatively mild disease that progresses very slowly or not at all. However, identification of factors that promote progressive fibrogenesis has been challenging [6]. Earlier research identified several factors that have been associated with faster fibrosis progression, including older age at infection [6, 7], male sex [6], excessive alcohol ingestion [6, 8], HIV coinfection [9], elevated alanine aminotransferase (ALT) levels [10], higher-level liver inflammation [10], and steatosis [11]. However, despite some understanding of the factors that promote fibrosis, identification of patients likely to progress to cirrhosis remains challenging.
A principal reason for current restrictions on HCV treatment access is its high cost, especially with the recently approved therapeutic regimens consisting of all oral, direct-acting antivirals [12, 13]. Professional society guidelines, such as those jointly authored by the American Association for the Study of Liver Diseases and the Infectious Diseases Society of America, have recommended that patients with advanced fibrosis and those at greater risk of rapidly progressive fibrosis should be prioritized for treatment [5]. Therefore, a more complete understanding of factors that promote fibrogenesis could be highly valuable for HCV clinical management; for guiding treatment prioritization, especially in areas where resources are limited; and for retreatment of patients who did not respond to direct-acting antivirals as we await the identification of optimal retreatment strategies. In this study, we retrospectively collected data from 378 patients with chronic HCV infection who underwent at least 2 liver biopsies and analyzed the effect of demographic, epidemiologic, and virologic variables on progressive fibrogenesis.
MATERIALS AND METHODS
Study Population
We extracted electronic medical record data on 378 patients with chronic HCV infection who underwent at least 2 liver biopsies and were evaluated at New York Presbyterian/Weill Cornell Medical College (WCMC) between 1997 and 2013. Consecutive liver biopsies were separated by at least 1 year from each other. Patients were either HCV treatment naive or treatment nonresponders. Exclusion criteria were cirrhosis diagnosed at the first liver biopsy, treatment-induced viral eradication, and liver transplantation between biopsies.
Specimens obtained by liver biopsy were formalin fixed, paraffin embedded, and subsequently evaluated according to the Scheuer classification system [14] by experienced hepatopathologists at WCMC. Since the Scheuer classification system uses an ordinal scale to assign values to grade and stage, evaluations that were not provided as an integer by staff pathologists were rounded in the analysis to a higher grade or stage (eg, grade 0–1 was rounded to 1 and grade 1–2 was rounded to 2). If portal and lobular inflammation were graded separately and if the grade was not the same, the higher grade was assigned to the biopsy specimen. The study was conducted in accordance with a protocol approved by the WCMC Institutional Review Board and was consistent with the standards established by the Helsinki Declaration of 1975.
Laboratory Measurements and Other Variables
The following data were extracted from the patients' electronic medical record: age at time of the first biopsy, sex, race/ethnicity, diagnoses (other than HCV infection), inflammatory grade and steatosis (when available) for each liver biopsy specimen, HCV treatment information (including medication type, duration, and treatment outcome), HCV RNA levels, ALT levels, aspartate aminotransferase (AST) levels, platelet count, and alkaline phosphatase measurements. We extracted levels of HCV RNA, ALT, AST, alkaline phosphatase, and platelets that were measured within 1 year preceding the first liver biopsy, as well as all measurements obtained between biopsies.
Statistical Analysis
Statistical analysis was performed using SAS (SAS Institute, Cary, North Carolina) and R (available at: http://www.r-project.org/). Associations between categorical variables were assessed through the Fisher exact test and logistic regression. The main outcome was fibrosis stage. We assessed the effect of various factors on fibrosis progression and estimated the progression rates between the different fibrosis stages, as opposed to assuming a constant progression rate. Fibrosis progression was defined as an increase of at least 1 stage between biopsies and as a binary variable. We used logistic regression to assess the associations between covariates and occurrence of fibrosis progression. Owing to the presence (15.1% [51 of 337]) of censored observations of HCV RNA levels (all but 1 measurement were above the upper limit of quantification; the exception was below the lower limit of detection), the respective right-censored HCV RNA data were imputed by the mean of the available observations, which were greater than the respective upper limit. We also assessed the association between fibrosis progression and flares in the ALT level that occurred during the follow-up period (ie, the interval between the first and last liver biopsies). Patients were eligible for this analysis if they had ALT levels assessed during the follow-up period, with the first measurement obtained within a year preceding the initial biopsy. A flare in the ALT level was defined as an increase above a predetermined threshold (100 or 200 U/L). The flare commenced when ALT values peaked above the threshold and terminated when the level decreased below the threshold. For each patient with available data (at least 2 ALT level measurements), the area under the ALT level curve was calculated (standardized by the duration of follow-up).
We used multistate Markov modeling to estimate the progression rates between different fibrosis stages. This model is appropriate for processes in which a subject's condition moves through a series of stages in continuous time. Usually the condition is observed at arbitrary times (ie, when a liver biopsy specimen is obtained), but the exact time when the condition changes is unobserved. Here, we used a 5-state model (stages 0–4) involving only progression to a neighboring stage. Owing to the possibility of error in the assessment of fibrosis stage (eg, misclassification due to inter-observer and intra-observer variability, liver sampling bias, and biopsy sample size bias), we used continuous-time hidden Markov models [15]. We used the matrices of misclassification, containing the probability for observing each of the stages given the true stage by [16]. The estimation of the parameters was done using the “msm” package in R. Initial values for the transition intensities for the model with misclassification were obtained from a model without misclassification. The significance level in all tests was set to 0.05.
RESULTS
Patient Characteristics
This study included data from 378 patients on whom at least 2 liver biopsies were performed. Patient's mean age (±standard deviation [SD]) was 48.3 ± 9.3 years, 59.3% were male, 59.9% were white, 24.3% were African American, and 14.7% were Hispanic (Table 1). The majority of patients (86.7%) were infected with HCV genotype 1. Additionally, one third (31.3%) were coinfected with HIV, of whom the majority were African American (74.7%) and only 8.1% were white (P < .0001). Information about HCV treatment between liver biopsies was available for 333 patients, 142 (42.6%) of whom were treated but did not achieve a sustained virological response.
Factors Associated With Fibrosis Progression During the Total Follow-up Period
| Variable | Subjects Evaluated, No. | All Subjects | Progressors | Univariable Regression | Multivariable Regressiona | ||
|---|---|---|---|---|---|---|---|
| OR (95% CI) | P | OR (95% CI) | P | ||||
| Age, y | 378 | 48.3 ± 9.25 | 47.7 ± 8.87 | 0.98 (.96–1.01) | .141 | … | |
| Sex | 378 | ||||||
| Male | 224 (59.3) | 121 (54.0) | 0.71 (.47–1.08) | .109 | … | ||
| Female | 154 (40.7) | 96 (62.3) | Reference | … | |||
| Race | 374 | ||||||
| White | 224 (59.9) | 119 (53.1) | Reference | .037 | Reference | .021 | |
| African American | 91 (24.3) | 53 (58.2) | 1.23 (.75–2.01) | 1.51 (.81–2.80) | |||
| Hispanic | 55 (14.7) | 41 (74.6) | 2.58 (1.33–5.01) | 3.22 (1.49–6.96) | |||
| Asian | 4 (1.1) | 3 (75) | 2.65 (.27–25.84) | 3.84 (.28–53.50) | |||
| HIV infection | 377 | ||||||
| Yes | 118 (31.3) | 74 (62.7) | 1.36 (.87–2.13) | .173 | … | ||
| No | 259 (68.7) | 143 (55.2) | Reference | … | |||
| HCV genotype | 377 | ||||||
| 1 | 327 (86.7) | 182 (55.7) | 0.59 (.31–1.11) | .103 | … | ||
| Non-1 | 50 (13.3) | 34 (68) | Reference | … | |||
| Inflammation grade | 376 | ||||||
| <2 | 137 (36.4) | 98 (71.5) | 2.58 (1.64–4.04) | <.001 | … | ||
| ≥2 | 239 (63.6) | 118 (49.4) | Reference | … | |||
| Fibrosis stage | 378 | ||||||
| <2 | 167 (44.2) | 143 (85.6) | 11.03 (6.58–18.49) | <.001 | 13.51 (7.44–24.53) | <.001 | |
| ≥2 | 211 (55.8) | 74 (35.1) | Reference | Reference | |||
| Steatosis | 222 | ||||||
| Present | 131 (59) | 78 (59.5) | 1.32 (.77–2.26) | .315 | … | ||
| Not present | 91 (41) | 48 (52.8) | Reference | … | |||
| Time between first and last biopsy, y | 378 | 6.5 ± 3.08 | 7.01 ± 3.05 | 1.13 (1.05–1.21) | <.001 | 1.07 (.98–1.17) | .108 |
| HCV treatment during follow-up | 333 | ||||||
| Yes | 142 (42.6) | 73 (51.4) | 0.63 (.40–.97) | .037 | … | ||
| No | 191 (57.4) | 120 (62.8) | Reference | … | |||
| ALT level, U/Lb | 314 | 74.4 ± 69.92 | 78.6 ± 82.64 | 1.02 (.99–1.06) | .244 | … | |
| Area under ALT level curve during follow-up | 320 | 68.2 ± 43.51 | 70.2 ± 41.59 | 1.03 (.97–1.08) | .312 | … | |
| Flares in ALT level during follow-up, by no. and level | |||||||
| At least 1 to >100 U/L | 344 | ||||||
| Yes | 161 (46.8) | 93 (57.8) | 0.95 (.62–1.46) | .81 | … | ||
| No | 183 (53.2) | 108 (59.0) | Reference | … | |||
| At least 1 to >200 U/L | 344 | ||||||
| Yes | 58 (16.9) | 40 (69) | 1.73 (.94–3.15) | .077 | 2.64 (1.30–5.36) | .007 | |
| No | 286 (83.1) | 161 (56.3) | Reference | … | |||
| At least 3 to >100 U/L | 344 | ||||||
| Yes | 43 (12.5) | 33 (76.7) | 2.61 (1.24–5.49) | .011 | … | ||
| No | 301 (87.5) | 168 (55.8) | Reference | … | |||
| At least 2 to >200 U/L | 344 | ||||||
| Yes | 20 (5.8) | 17 (85) | 4.31 (1.24–15.00) | .022 | … | ||
| No | 324 (94.2) | 184 (56.8) | Reference | … | |||
| AST level, U/Lb | 293 | 56.1 ± 40.01 | 59.6 ± 47.1 | 1.06 (.99–1.14) | .103 | … | |
| Log10 HCV RNA load, IU/mL | 303 | 6.06 ± 0.82 | 5.98 ± 0.87 | 0.78 (.58–1.03) | .081 | … | |
| Platelet count, ×103 platelets/μL | 232 | 218.7 ± 85.06 | 213.7 ± 60.11 | 1.00 (1.00–1.00) | .313 | … | |
| Alkaline phosphatase level, U/L | 191 | 91.4 ± 40.4 | 92.8 ± 41.41 | 1.00 (1.00–1.02) | .556 | … | |
| APRI | 227 | 0.69 ± 0.74 | 0.70 ± 0.61 | 1.03 (.72–1.48) | .855 | … | |
| FIB-4c | 227 | 1.74 ± 1.29 | 1.71 ± 0.91 | 0.96 (.78–1.17) | .676 | … | |
| Ratio of AST to ALT levels | 293 | 0.89 ± 0.36 | 0.89 ± 0.36 | 1.05 (.55–2.01) | .884 | … | |
Data are no. (%) of subjects or mean value ± SD, unless otherwise indicated. Total follow-up was defined as the interval between the first and last biopsy. All measurements were obtained at baseline (ie, at time of the first biopsy) or within 1 year preceding the first biopsy, unless otherwise specified.
Abbreviations: ALT, alanine aminotransferase; APRI, AST to platelet ratio index; AST, aspartate aminotransferase; CI, confidence interval; FIB-4, fibrosis 4; HCV, hepatitis C virus; HIV, human immunodeficiency virus; OR, odds ratio.
a Based on data from 342 patients.
b OR of increase with 10 units.
c FIB-4 is a noninvasive fibrosis assessment index calculated as: (age [years] × AST [U/L])/platelets [109/L] × (ALT [U/L])1/2.
Intrahepatic inflammation in the initial biopsy specimen was absent or mild (grade 1) among 36.4% of patients and moderate (grade 2) among the majority of patients (56.9%), while only 6.7% of patients had severe inflammation (grade 3). Fibrosis was absent in 11.9% of patients, 32.3% of patients had stage 1 fibrosis, 39.4% had stage 2 fibrosis, and 16.4% had stage 3 fibrosis. Moderate-to-severe fibrosis (stage ≥2) was significantly associated with elevated inflammation (grade ≥2) in the initial biopsy specimen (odds ratio [OR], 9.00; 95% confidence interval [CI], 5.53–14.64; P < .001). Steatosis was present in the majority of patients (59%) in whom it was assessed (n = 222). The presence of steatosis was significantly associated with higher fibrosis stage (stage ≥2; OR, 2.39; 95% CI, 1.38–4.14; P = .002) and higher inflammation (grade ≥2; OR, 4.07; 95% CI, 2.26–7.35; P < .001) in the initial biopsy specimen.
Fibrosis Progression Over the Total Study Period
Our data comprised findings from 936 liver biopsies, with a range of 2 to 5 biopsies per person: 240 patients underwent 2 biopsies, 98 underwent 3 biopsies, 38 underwent 4 biopsies, and 2 underwent 5 biopsies (Table 2). Thus, we had 558 consecutive biopsy pairs (eg, a patient who underwent 5 liver biopsies would contribute 4 consecutive biopsy pairs) that were used to analyze stage-specific fibrosis progression as described below. The mean duration (±SD) between the first and the last biopsy was 6.5 ± 3.1 years, while the mean duration (±SD) between paired biopsies was 4.4 ± 1.9 years.
Frequency of Fibrosis Stages at Each Biopsy
| Stage | Biopsy 1 | Biopsy 2 | Biopsy 3 | Biopsy 4 | Biopsy 5 | |||||
|---|---|---|---|---|---|---|---|---|---|---|
| No. (%) | CF | No. (%) | CF | No. (%) | CF | No. (%) | CF | No. (%) | CF | |
| 0 | 45 (11.9) | 45 | 11 (2.91) | 11 | 3 (2.17) | 3 | 1 (2.5) | 1 | … | … |
| 1 | 122 (32.28) | 167 | 80 (21.16) | 91 | 29 (21.01) | 32 | 9 (22.5) | 10 | 1 (50) | 1 |
| 2 | 149 (39.42) | 316 | 182 (48.15) | 273 | 63 (45.65) | 95 | 16 (40) | 26 | 1 (50) | 2 |
| 3 | 62 (16.4) | 378 | 82 (21.69) | 355 | 28 (20.29) | 123 | 7 (17.5) | 33 | … | … |
| 4 | … | … | 23 (6.08) | 378 | 15 (10.87) | 138 | 7 (17.5) | 40 | … | … |
Abbreviation: CF, cumulative frequency.
During the total follow-up period, defined as the interval between the first and the last biopsy, 217 patients (57.4%) progressed by at least 1 fibrosis stage, 61 (16.1%) had more-severe fibrosis progression of at least 2 fibrosis stages, and 40 (10.6%) developed stage 4 fibrosis (which includes both stage 3–4 and stage 4). A total of 22 patients (5.82%) progressed to cirrhosis (defined exclusively as stage 4 fibrosis) during the total study period.
Factors Associated With Fibrosis Progression
We first investigated the effect of factors associated with fibrosis progression over the total follow-up period (ie, between the first and the last biopsy; Table 1). Based on univariable logistic regression analysis, progression by at least 1 fibrosis stage was significantly associated with mild inflammation (grade < 2; OR, 2.58; 95% CI, 1.64–4.04; P < .001) and mild fibrosis (stage < 2) in the initial biopsy specimen (OR, 11.03; 95% CI, 6.58–18.49; P < .001). Additional significant factors on univariable analysis included a longer duration of follow-up (OR, 1.13; 95% CI, 1.05–1.21; P < .001), the presence of multiple flares in the ALT level during the entire study period, and HCV treatment during follow-up (OR, 0.63; 95% CI, .40–.97; P = .037). On multivariable analysis, fibrosis progression was significantly associated with mild fibrosis (stage <2) at the first biopsy (OR, 13.51; 95% CI, 7.44–24.53; P < .001) and the presence of at least 1 flare in the ALT level (200 U/L threshold) during the follow-up period (OR, 2.64; 95% CI, 1.30–5.36; P = .007). In addition, Hispanic patients were more likely to progress than white patients (OR, 3.22; 95% CI, 1.49–6.96; P = .021). When we combined Hispanic patients with white patients, we did not see significant differences in fibrosis progression between races. HCV treatment between the biopsies was not significantly associated with fibrosis progression on multivariable analysis.
Evaluation of Fibrosis Progression Rate
The 378 patients contributed 558 pairs of consecutive biopsies. Fibrosis progression by 1 stage was detected in 203 consecutive biopsies (36.4%) and progression by 2 or 3 stages was observed in 47 consecutive biopsies (8.4%; Table 3). We used a multistate Markov model to estimate the progression (transition) rates between different fibrosis stages, after accounting for possible misclassification in the assessment of liver fibrosis, based on the observed transition frequencies (Table 4 and Figure 1). The estimated progression rate from stage 0 to stage 1 was the highest, and it was 3.08 times higher (95% CI, 1.57–6.07) than the progression rate from stage 1 to stage 2. The progression rate from stage 2 to stage 3 was the lowest. The estimated sojourn time (ie, the mean occupancy period of a single stage) was the shortest for fibrosis stage 0 (2.55 years; 95% CI, 1.61–4.04 years) and the longest for fibrosis stage 2 (18.4 years; 95% CI, 11.5–29.4 years). This explains the lower estimated probability for transition from stage 0 to stage 1 after 10 years (Table 4). Additionally, we conducted a subgroup analysis on the patients who underwent >2 biopsies. The estimated fibrosis progression rates were 0.34 (95% CI, .199–.588) between stages 0 and 1, 0.09 (95% CI, .049–.155) between stages 1 and 2, 0.07 (95% CI, .04–.119) between stages 2 and 3, and 0.10 (95% CI, .033–.279) between stages 3 and 4 and are consistent with the data obtained on the overall data set.
Fibrosis Progression Between Consecutive Biopsies
| Initial Stage | Subsequent Stage, Transitions, No. (%) | ||||
|---|---|---|---|---|---|
| 0 | 1 | 2 | 3 | 4 | |
| 0 | 9 (17.3) | 24 (46.2) | 17 (32.7) | 2 (3.8) | 0 (0) |
| 1 | 2 (1.1) | 58 (33.1) | 102 (58.3) | 12 (6.9) | 1 (0.6) |
| 2 | 4 (1.8) | 33 (14.5) | 122 (53.7) | 53 (23.3) | 15 (6.7) |
| 3 | 0 (0) | 4 (4.1) | 20 (20.6) | 49 (50.5) | 24 (24.7) |
| 4 | 0 (0) | 0 (0) | 1 (14.3) | 1 (14.3) | 5 (71.4) |
Multistate Model of Fibrosis Progression (Progression Rates Between Different States), Based on Continuous Time Hidden Markov Model
| Transitions Between Stages | Probability for Transition After 2, 5, and 10 y | |||
|---|---|---|---|---|
| Estimated Transition Intensity (95% CI) | 2 y (95% CI) | 5 y (95% CI) | 10 y (95% CI) | |
| 0–0 | … | 0.456 (.29–.62) | 0.14 (.05–.29) | 0.02 (.002–.09) |
| 0–1 | 0.39 (.25–.62) | 0.472 (.33–.61) | 0.575 (.44–.68) | 0.385 (.24–.54) |
| 1–1 | … | 0.775 (.66–.85) | 0.529 (.35–.68) | 0.279 (.14–.44) |
| 1–2 | 0.13 (.08–.20) | 0.213 (.14–.32) | 0.407 (.27–.56) | 0.525 (.39–.66) |
| 2–2 | … | 0.897 (.84–.93) | 0.762 (.65–.84) | 0.581 (.44–.70) |
| 2–3 | 0.05 (.03–.09) | 0.091 (.06–.14) | 0.176 (.11–.28) | 0.23 (.12–.36) |
| 3–3 | … | 0.785 (.6–.89) | 0.545 (.29–.75) | 0.298 (.08–.55) |
| 3–4 | 0.12 (.06–.26) | 0.215 (.11–.40) | 0.455 (.25–.71) | 0.702 (.45–.91) |
Abbreviation: CI, confidence interval.
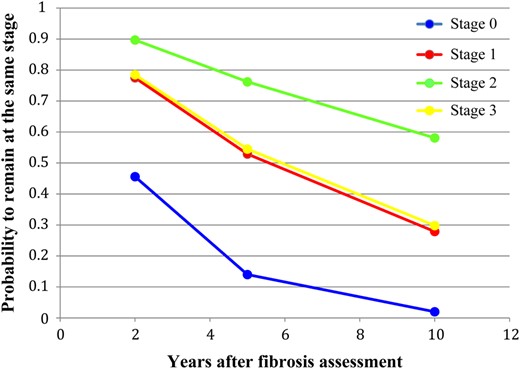
Probability of remaining at the same fibrosis stage (nonprogression) 2, 5, and 10 years after the initial fibrosis assessment.
Next, we assessed the effect of various covariates on the fibrosis progression rates and found that higher inflammation and, to lesser extent, higher overall ALT levels had an influence on the transition rates. However, the effect of inflammatory grade was significant only for the transition from stage 1 to stage 2, with a hazard ratio of 3.04 (95% CI, 1.24–7.49), and the influence of the area under the ALT level curve was significant only for the transition from stage 2 to stage 3, with a hazard ratio of 1.16 (95% CI, 1.06–1.28).
Factors Associated With Progression to Cirrhosis
Twenty-two patients (5.8%) progressed to cirrhosis over the total follow-up period. The mean duration (±SD) from biopsy 1 to development of cirrhosis was 7.6 ± 3.6 years. From multivariable logistic regression modeling, progression to cirrhosis was associated with genotype 3 (OR, 4.93; 95% CI, 1.1–22.7; P = .04) and with area under the ALT level curve (OR, 1.23; 95% CI, 1.1–1.38, P < .001). A trend for association was found with higher stage of fibrosis at the first biopsy (OR, 6.16; 95% CI, .94–40.29; P = .058) and lower baseline platelet levels (OR, 0.9; 95% CI, .81–1.001; P = .053).
DISCUSSION
In this study, we evaluated factors that influence fibrosis progression and cirrhosis development in chronic HCV infection, which occurred in 57.4% and 5.8% of our patient population, respectively, over a mean period (±SD) of 6.5 ± 3.1 years. Mild fibrosis (stage <2) in the first biopsy specimen and flares in the ALT level of >200 U/L were significantly associated with fibrosis progression. In addition, we estimated the progression rates between different fibrosis stages and found the highest rate between stages 0 and 1 and the lowest between stages 2 and 3. Hepatic necroinflammation was shown to influence progression from stage 0 to stage 1, while higher ALT levels between biopsies were found to influence the progression rate at higher stages. We also noted that HCV genotype 3–infected patients were more likely to progress to cirrhosis.
Studies of fibrosis progression have conventionally used either paired biopsies or have estimated the acquisition date of the infection and subsequently calculated the time until the first fibrosis assessment (either by liver biopsy or noninvasive tests). These studies are usually limited by small sample sizes and by an even smaller number of patients who had progressive liver disease [10, 17]. In some studies, constant fibrosis progression in a linear fashion has been assumed [6, 10, 18, 19], resulting in the common acceptance of this notion by the hepatology community. For example, a pioneering study that estimated duration of infection on the basis of a single liver biopsy in a very large number of patients incorporated the concept of linear fibrosis progression and, contrary to our findings, reported very slow fibrosis progression during the first 10 years of the infection, with subsequent progressive acceleration of fibrosis [20]. Although that important study was cross-sectional, it attempted to describe fibrosis progression as a linear process based on the estimated infection duration. However, given the largely asymptomatic course of HCV infection until the end stage, estimates of duration of infection may be subject to bias.
The fibrosis progression rate has been shown previously to vary between different stages [19, 21, 22], and a stage-specific progression rate is a more informative way to quantify the progression process. In our study, we estimated stage-specific progression rates and assessed for the effect of patient covariates while accounting for misclassification of fibrosis stage. We found heterogeneous progression rates between the different stages, with the highest rate detected between stages 0 and 1. Higher fibrosis progression rates at the lower fibrosis stages have also been reported by other investigators, who used different methods to assess progressive disease [19, 22, 23]. Another early study, which also used multistate Markov modeling, illustrated varying rates of fibrosis progression that were more rapid at lower stages of fibrosis [22]. In that work, the authors analyzed progression rates between stage 1 or less, stage 2, and stage 3 or greater, and they did not account for misclassification. Butt et al used the noninvasive assay FIB4 performed serially on 1840 HCV-infected US veterans and found that fibrosis progression started early and was most pronounced within the first 5 years of infection [23]. Thein et al [19] evaluated the stage-specific progression rates through a meta-analysis of 111 studies, using the Markov maximum likelihood method, and found the lowest transition rate between stages 1 and 2, with other stage-specific transition rates all being very similar. Differences between our results and those of Thein et al could partially be because they evaluated transition rates on the basis of the duration of infection, estimated from the time of viral acquisition, while our results estimated fibrosis progression between 2 biopsies.
Accelerated fibrosis progression has been detected previously in some HCV-infected individuals [24] and in specific populations, such as HIV-infected men who acquired HCV via sexual transmission. In these men, a rapid onset of fibrosis occurs in the first 1–2 years after primary infection [25, 26]. They have also been shown to have faster development of the clinical consequences of end-stage liver disease [27]. However, in contrast to these findings and results of other studies conducted in the era of highly effective antiretroviral therapy [28], we did not observe an association between fibrosis progression and HIV coinfection. This result could potentially be explained by well-controlled HIV viremia in coinfected patients, as suggested by a recently published comprehensive review [29]. Unfortunately, insufficient data (ie, CD4+ T-cell counts, HIV loads, and HIV treatment information) did not allow us to further explore this possibility. Future studies with a larger number of coinfected patients and systematic measurements of CD4+ T cells and HIV loads between fibrosis assessments should be performed to further address the question of HIV influence on fibrosis progression in HCV/HIV-coinfected patients.
We also identified a significant association between progression to cirrhosis and infection with HCV genotype 3, consistent with previous findings that genotype 3–infected patients have a higher risk of development of cirrhosis and hepatocellular carcinoma [30, 31]. This finding, however, should be interpreted cautiously because of the small number of HCV genotype 3–infected individuals included. In our study population, we did not identify an association between fibrosis progression and steatosis, while such an association has been reported in other studies [32].
The major strength of our study is the relatively large sample size and the number of evaluated biopsy specimens. In addition, we estimated the stage-specific fibrosis progression rates. Moreover, while most previous studies have relied on a single biopsy and have evaluated fibrosis progression by estimating the time of infection onset, we had data on ≥2 biopsies per patient that allowed us to estimate the fibrosis progression rates between different stages. Evaluation of fibrosis progression can be difficult owing to the complexities, specifically the high cost and invasive nature of the biopsy, of obtaining multiple liver biopsy specimens from the same individual over time. Furthermore, because of the reduced frequency with which liver biopsies are currently performed in clinical practice, future studies of histologic progression in HCV infection will increasingly rely on data derived from noninvasive methods of fibrosis assessment, such as transient elastography or multiparameter serum fibrosis indices. Unfortunately, certain parameters that play important roles in modifying fibrosis progression, such as the level of portal and lobular inflammation or steatosis, may not be readily obtainable from these alternative methods. Consequently, our data offer insights into HCV-specific fibrogenesis that would be impossible to obtain by using data derived from noninvasive measures of liver fibrosis. Potential limitations of this work include the possibility of biopsy sampling error and inter-observer variability in histologic interpretation, as grade and stage were evaluated by different staff pathologists. In addition, we did not have data on infection onset and the amount of alcohol consumption.
In summary, we found varying stage-specific progression rates in patients with chronic hepatitis C. Patients with a lower initial fibrosis stage and those who experienced flares in the ALT level were found to have the highest rate of fibrosis progression, while patients infected with HCV genotype 3 had the higher risk of development of cirrhosis. Although our results provide additional insights into the factors that affect HCV-related fibrogenesis, prospective studies with larger numbers of patients, particularly among underrepresented ethnic and racial minority subpopulations, would be necessary for accurate identification of individuals most likely to have a progressive disease.
Notes
Financial support. This work was supported by the Troup Fund of the Kaleida Health Foundation and the Greenberg Foundation for Medical Research.
Potential conflicts of interest. A. H. T. has received grant/research support from Merck, Gilead, Tibotec, Abbott, AbbVie, Galectin, Intercept, Tobira, and Lily; has been a consultant/advisor for Merck, Pfizer, Abbott Diagnostics, AbbVie, and the Chronic Liver Disease Foundation; and is a member of speakers' bureaus for the Chronic Liver Disease Foundation and the Empire Liver Disease Foundation. I. M. J. has received grant/research support from AbbVie, Bristol Myers Squibb, Gilead, Janssen, and Merck; has been a consultant/advisor for AbbVie, Achillion, Bristol Myers Squibb, Intercept, Gilead, Janssen, Merck, and Trek; and is on speakers' bureaus for AbbVie, Bristol Myers Squibb, Gilead, and Janssen. All other authors report no potential conflicts. All authors have submitted the ICMJE Form for Disclosure of Potential Conflicts of Interest. Conflicts that the editors consider relevant to the content of the manuscript have been disclosed.
References
Author notes
Presented in part: 66th Annual Meeting of the American Association for the Study of Liver Diseases, San Francisco, California, 13–17 November 2015. Abstract 1841.
M. Z. and R. B. D. contributed equally to this work.
Present affiliations: Clinical Directors Network, Inc., 5 West 37th Street, 10th Floor, New York, New York (M. Z.) and Center for Biologics Evaluation and Research, Food and Drug Administration, Silver Spring, Maryland (R. B. D.).

